Vancomycin Pharmacokinetics
Pharmacokinetics (PK) can be used to individualize vancomycin dosage based on goal levels and the AUC
Definitions
-
Volume of distribution (Vd) is an apparent volume with the same concentration of drug as found in the serum from a given dose. For example, if a 1000mg dose increased the serum level by 20 mg/L, the apparent Vd would be about 50 L.
-
Elimination rate constant (Ke) is a value used to express the proportion of drug eliminated per hour. If Ke = 0.12 hr-1 then 12% of drug is being eliminated per hour.
-
Vancomycin clearance (CLv) is the volume of blood cleared of vancomycin per hour (L/hour), and is the product of Vd and Ke.
-
Area under the curve (AUC) is the area under the concentration-time curve. The daily AUC is the primary measure for safety and efficacy, and it depends on the total daily dose.
-
Steady state means that peak and trough levels are consistent and stable with each dose.
Streamlining Application of PK Dosing
-
When ordering a steady state level, schedule it with morning labs to minimize blood draws
-
Work with lab and nursing so that vancomycin levels and administration times are documented in the medical record
-
Use the loading dose feature to standardize administration times; adjust the loading dose based on when the maintenance dose will start
-
Standardize infusion rates (750 or 1000 mg/hr)
-
Use a flowsheet to document dosage, administration times, SCr, and drug levels with draw times. This helps to see the big picture and to improve communication.
Basic Concepts and Equations


Estimating PK Parameters
Vancomycin clearance (CLv) models
CLv is estimated at the start of treatment to calculate a maintenance dose. Here are some population models for CLv. The units are in ‘ml/min’ and can be converted to the standard units L/hour by multiplying the result by 0.06.
| VancoPK: | CLv = 0.75 (CrCl) + 4 |
| Matzke: | CLv = 0.689 (CrCl) + 3.66 |
| Ambrose: | CLv = CrCl |
| Birt: | CLv = 0.674 (CrCl) + 13.45 |
| Buelga: | CLv = 1.08 (CrCl) |
| Burton revised: | CLv = 0.80 (CrCl) |
The VancoPK equation, updated November 2023, was derived using linear regression of vancomycin clearance (CLv) and creatinine clearance (CrCl). CrCl was calculated with the Cockcroft-Gault equation, with an adjusted BW used for overweight patients (BMI >25). CLv was calculated from steady state peak and trough levels collected from this website and from a separate data set collected by clinicians from many hospitals in the US. Literature and clinical experience were also used to create the final CLv model.
The correlation between CLv and CrCl is weak overall, which is one reason why we monitor vancomycin levels. The VancoPK equation has essentially the same Y-intercept as the Matzke equation. The Birt equation appears to overestimate CLv in patients who have renal impairment, while the Buelga and Ambrose models appear to overestimate CLv for most patients.
Figure 17. A comparison of empiric vancomycin clearance models

Volume of distribution (Vd) models
In general Vd ranges from about 0.5- 1.0 L/kg, with a range of about 25-130 L. Vd is often estimated to calculate a loading dose, estimate a SS peak and trough, estimate the AUC from trough-only data, and calculate the change in serum concentration from a dose. Here are some equations for estimating Vd:
| VancoPK: | Vd = 0.29 (age) + 0.33 (actual BW in kg) + 11 |
| Birt: | Vd = 0.54 L/kg |
| Winter: | Vd = 0.70 L/kg |
| Tanaka: | Vd = 0.864 L/kg |
There is limited evidence from large, robust study populations regarding how to estimate Vd. The VancoPK equation, published in 2021, can be applied to patients who have low body weight, normal weight, and who are extremely obese. In general, Vd is about 0.9 L/kg in underweight patients and about 0.5 L/kg in very obese patients. Adane, et al. (2015) studied Vd in extremely obese patients who had a median body weight of 148 kg and a mean Vd of 0.51 L/kg. A study by Tanaka, et al. (2009) of Japanese adult patients had a mean body weight of 53 kg and a mean Vd of 0.864 L/kg.
While most Vd models only include body weight, many studies have found that age also plays a role in vancomycin Vd. Older patients have a larger Vd at steady state compared to younger adults, which has been ascribed to changes in peripheral circulation and enhanced tissue binding in the elderly. Older patients generally mobilize vancomycin from body tissues and fluids into the serum less well than younger adults.
Vd is larger at the start of therapy versus at steady state, so the loading dose calculator (initial dosing calculator) increases Vd by 25% to improve the loading dose calculations.
Elimination rate constant (Ke)
Many sources estimate Ke with the equation: Ke = 0.00083 (CrCl) + 0.0044, but Ke also depends on Vd. Ke can be calculated at the start of therapy from Vd and CLv which have been estimated from population models. Ke can be used to estimate SS levels and calculate a level at a given time. One special setting is intermittent hemodialysis, when Ke can be estimated as 0.005 hr-1.
\(
\Large \color {black} {Ke = \frac{CLvanco}{Vd}}
\)
Ke ranges from about 0.003 hr-1 (231 hr half-life) to about 0.25 hr-1 (2.8 hr half-life).
AUC Goals and Calculation
AUC goals
The vancomycin monitoring guidelines recommend targeting a daily AUC of 400- 600 for serious MRSA infections. Clinicians may choose to target a higher AUC range for severe, hard-to-penetrate infections such as endocarditis. Prolonged daily AUCs >650 appear to increase the risk of nephrotoxicity.
Calculating an AUC24
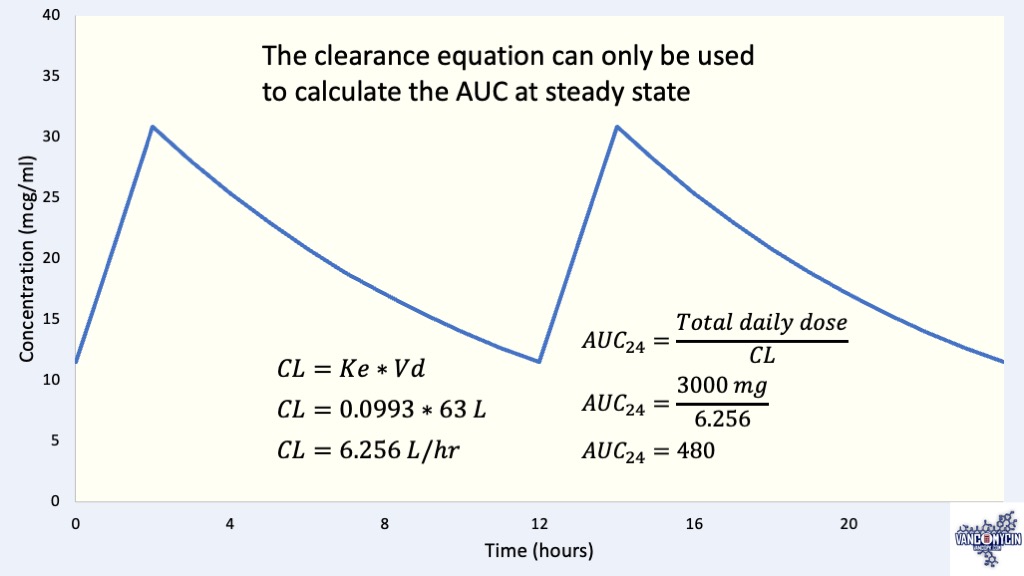
The easiest setting for calculating AUC24 is continuous infusions. Maintaining a serum level of 20 mcg/ml would have an AUC24 of 480 (24 hours * 20 mcg/ml = 480).
When levels are at steady state, the clearance equation can be used to calculate the AUC:
\(
\Large \color {black} {
AUC_{24} = \frac{Total\: daily\: dose}{CL_{vanco}}
}
\)
Trapezoidal equations can be used to calculate an AUC, even when levels are not at steady-state. The linear equation, Lin trap, expresses AUC during infusion. The log equation, Log trap, expresses AUC during elimination. If the dosing interval is every 12 hours, then the AUC would need to be multiplied by 2 to get the daily AUC, etc.
\(
\large \color {black} {
\begin{aligned}
AUC & = Lin\: trap + Log\: trap\\
& Lin\: trap = ti * \frac{C\: start\: of\: infusion + C\: end\: of\: infusion}{2}\\
& Log\: trap = \frac{(Chigh-Clow)}{Ke}
\end{aligned}
}
\)
Dosage Considerations
For patients with normal kidney function a usual dose is about 10-20 mg/kg every 8 to 12 hours, with a max of about 25 mg/kg or 2000 mg per dose. Doses greater than 20 mg/kg or 1500 mg with dosing intervals ≥12 hours can produce deceptively low troughs, e.g., the AUC24 can be supra-therapeutic with a normal-looking trough.
Loading dose
Loading doses (LD) achieve therapeutic drug levels quickly and help the first steady state level to be closer to full steady state. Loading doses can be given routinely to all patients, but are necessary for patients who have renal impairment (prolonged half-life) or severe infection. The goal of a loading dose is to produce a level close to the steady state trough at the start of the maintenance dose. The Loading Dose Calculator on the Initial Dosing Calculator allows users to select a loading dose depending on when the maintenance dose will begin.
\(
\Large \color {black} {LD = desired\: peak * Vd}
\)
Calculating a maintenance dose based on a goal daily AUC
\(
\Large \color {black} {Daily\: dose = CL_{v} * Desired\: AUC}
\)
To calculate an empiric maintenance dose based on a desired AUC, first estimate CLv: CLv = 0.06*(0.75 * CrCl + 4). For example, if a patient’s estimated CrCl is 106 mL/min, CLv = 5.0 L/hour. If a desired AUC24 ~500, then the daily dose would be 2,500 mg divided two times daily = 1,250 mg q12h
Using Levels to Calculate Vancomycin Clearance
There are three ways to calculate vancomycin clearance from measured levels without the use of population models: 1) two levels after the first dose, 2) two levels at steady state, and 3) three non-steady-state levels. Patients are often less stable when starting vancomycin, so measuring levels after the first dose may be less reliable than at steady state.
Two levels after the first dose
This approach may be useful for bed bound patients who often have an artificially low SCr due to reduced muscle mass. Since this requires obtaining an additional blood sample, many clinicians prefer to instead round the SCr up to about 0.8 mg/dL to estimate a maintenance dose, and then check a level at steady state.
Figure 18. Two levels after the first dose can be used to calculate PK parameters
Steady-state peak and trough
Measuring a peak and trough at steady state is often difficult to do in clinical practice. Steady state conditions need to be present and the levels need be drawn appropriately (see Figures 1, 3, 6, 7). Since population models are not used in the calculations the results are more difficult to interpret. When evaluating results, compare the AUC with the Steady State Trough calculator’s AUC, and if the difference in AUCs is greater than 100 points then there may be an issue with how the peak and trough were drawn, reported, or entered into the calculator.
Figure 19. Two levels at steady state can be used to calculate PK parameters
Three non-steady-state levels
When levels are not at steady-state three levels are needed to calculate patient-specific parameters. This approach is sometimes used for ICU patients.
Figure 20. Three non-steady-state levels can be used to calculate PK parameters
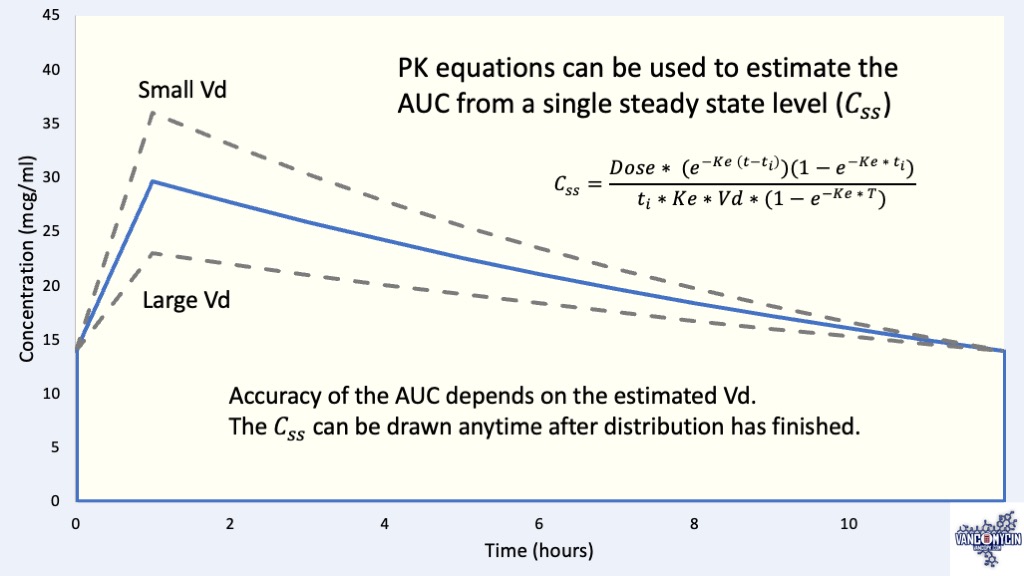
Estimating an AUC from a Steady State Trough
After measuring a SS trough the equation below can be used to solve for Ke by using an estimated Vd from a population model. This allows us to estimate CLv and the AUC.
-
-
Vd is estimated from a population model
-
Vd and SS trough data are used to solve for Ke by iteration
-
Vancomycin clearance is calculated
-
The AUC is calculated from the patient’s total daily dose
-
\(
\Large \color {black} {
C_{ss} = \frac {
Dose * (e ^ {-K (time\: from\: start\: of\: dose\: to\: C_{ss} – t_i)}) (1 – e ^ {-K * t_i})
}{
t_i * K * V * (1 – e ^ {-K*T})
}
}
\)
Css = steady-state level, T = dosing interval (hrs), ti = infusion time (hrs)
Conclusion
The vancomycin monitoring guidelines recommend targeting an AUC range of 400-600 for serious MRSA infections. Initial dose calculations depend on an estimated CrCl and a desired AUC, but the correlation between CLv and CrCl is weak. Loading doses can be used for all patients to achieve therapeutic drug levels quickly and to help make the first steady state trough closer to full steady state.
The Steady-State Trough calculator uses first-order PK equations to estimate an AUC. Dosage can be titrated to target the middle of a desired AUC range, usually 500. Clinicians may choose to target a higher AUC range for severe, hard-to-penetrate infections such as endocarditis.
Obtaining a peak and trough after the first dose may be considered for bed bound patients or ICU patients in septic shock. When measuring two levels after a dose appropriate timing of the levels is important: Peak levels need to be drawn at least 60 minutes after the end of infusion, and the second level needs to be drawn at least 4 hours after the peak.
Feel free to contact me with any questions or feedback.
Equations
Clearance equation
\(
\Large \color{black}
{CL_{v} = Ke * Vd}\)
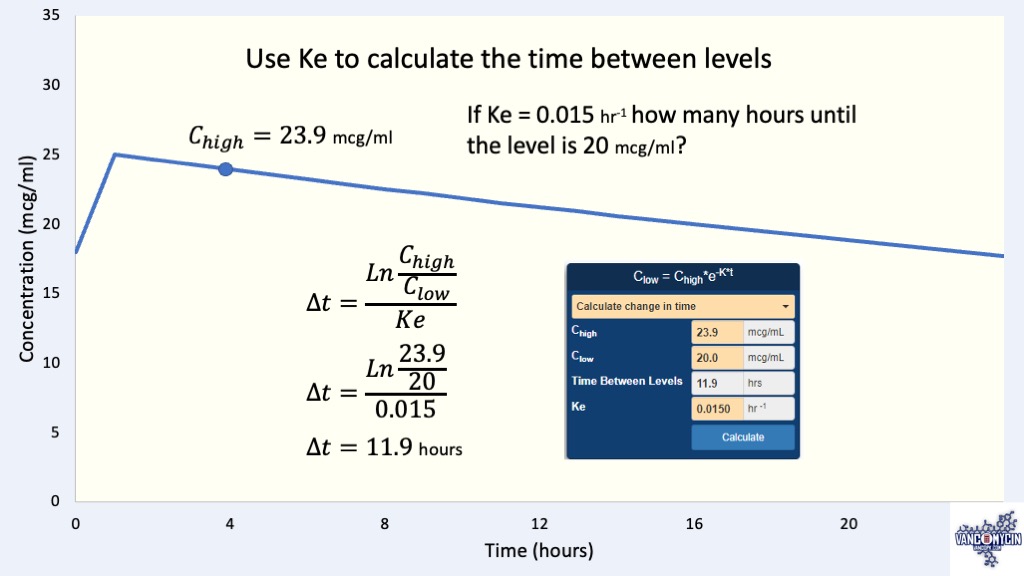
Elimination equations
\Large \color{black} {C_{low}=C_{high}*e^{-Ke*t}}
\)
Used to calculate a level (Clow or Chigh) based on Ke and the time (hours) between the levels.
\Large \color{black} {Ke = \frac{Ln\frac{C_{high}}{C_{low}}}{∆t}}
\)
Same equation as above, written to calculate Ke or the change in time (hours) between levels.
\Large \color{black} {t_{1/2} = \frac{Ln2}{Ke}}
\)
Half-life is the amount of time it takes for a level to decrease by half.
Change in serum concentration (∆C) equations
\Large \color{black} {∆C = \frac{Dose}{Vd}}
\)
This equation is useful for estimating ∆C from a single dose but it assumes IV push administration so does not account elimination during the infusion time
\Large \color{black} {∆C= \frac{Dose*(1-e^{-K*t_i })}{t_i*K*V}}
\)
Steady state peak and trough equations
\(
\Large \color {black} {
Cmax_{ss} = \frac
{Dose(1 – e^{-K*t_i})}
{K*V*t_i*(1 – e^{-K*T})}}
\)
\(
\Large \color {black} {
Cmin_{ss} = Cmax_{ss} * e^{-K(T – t_i)}}
\)
References
- Adane ED, Herald M, Koura F. Pharmacokinetics of vancomycin in extremely obese patients with suspected or confirmed Staphylococcus aureus infections. Pharmacotherapy. 2015;35(2):127-139
- Winter MA, Guhr KN, Berg GM. Impact of various body weights and serum creatinine concentrations on the bias and accuracy of the Cockcroft-Gault equation. Pharmacotherapy. 2012 Jul;32(7):604-12.
- Rybak MJ, Le J, Lodise TP, et al. Therapeutic monitoring of vancomycin for serious methicillin-resistant Staphylococcus aureus infections: A revised consensus guideline and review of the American Society of Health-System Pharmacists, the Infectious Diseases Society of America, the Pediatric Infectious Diseases Society and the Society of Infectious Diseases Pharmacists. Accessed April 2020. Available online at IDsociety.org.
- Casapao AM, Lodise TP, Davis SL, et al. Association between vancomycin day 1 exposure profile and outcomes among patients with MRSA infective endocarditis. Antimicrob Agents Chemother. 2015; 59(6): 2978-85.
- Neely MN, Youn G, Jones B, et al. Are vancomycin trough concentrations adequate for optimal dosing? Antimicrob Agents Chemother. 2014;58(1):309-16.
- DeRyke CA, Alexander DP. Optimal vancomycin dosing through pharmacodynamic assessment targeting area under the concentration-time curve/minimum inhibitory concentration. Hospital Pharmacy. 2009;44(9):751-765.
- Bauer LA. Vancomycin. In: Applied Clinical Pharmacokinetics, 3rd Ed. New York: McGraw Hill, 2014.
- Tanaka A, Aiba T, Otsuka T, et al. Population pharmacokinetic analysis of vancomycin using serum cystatin C as a marker of renal function. Antimicrob Agents Chemother. 2010 Feb;54(2):778-82.